
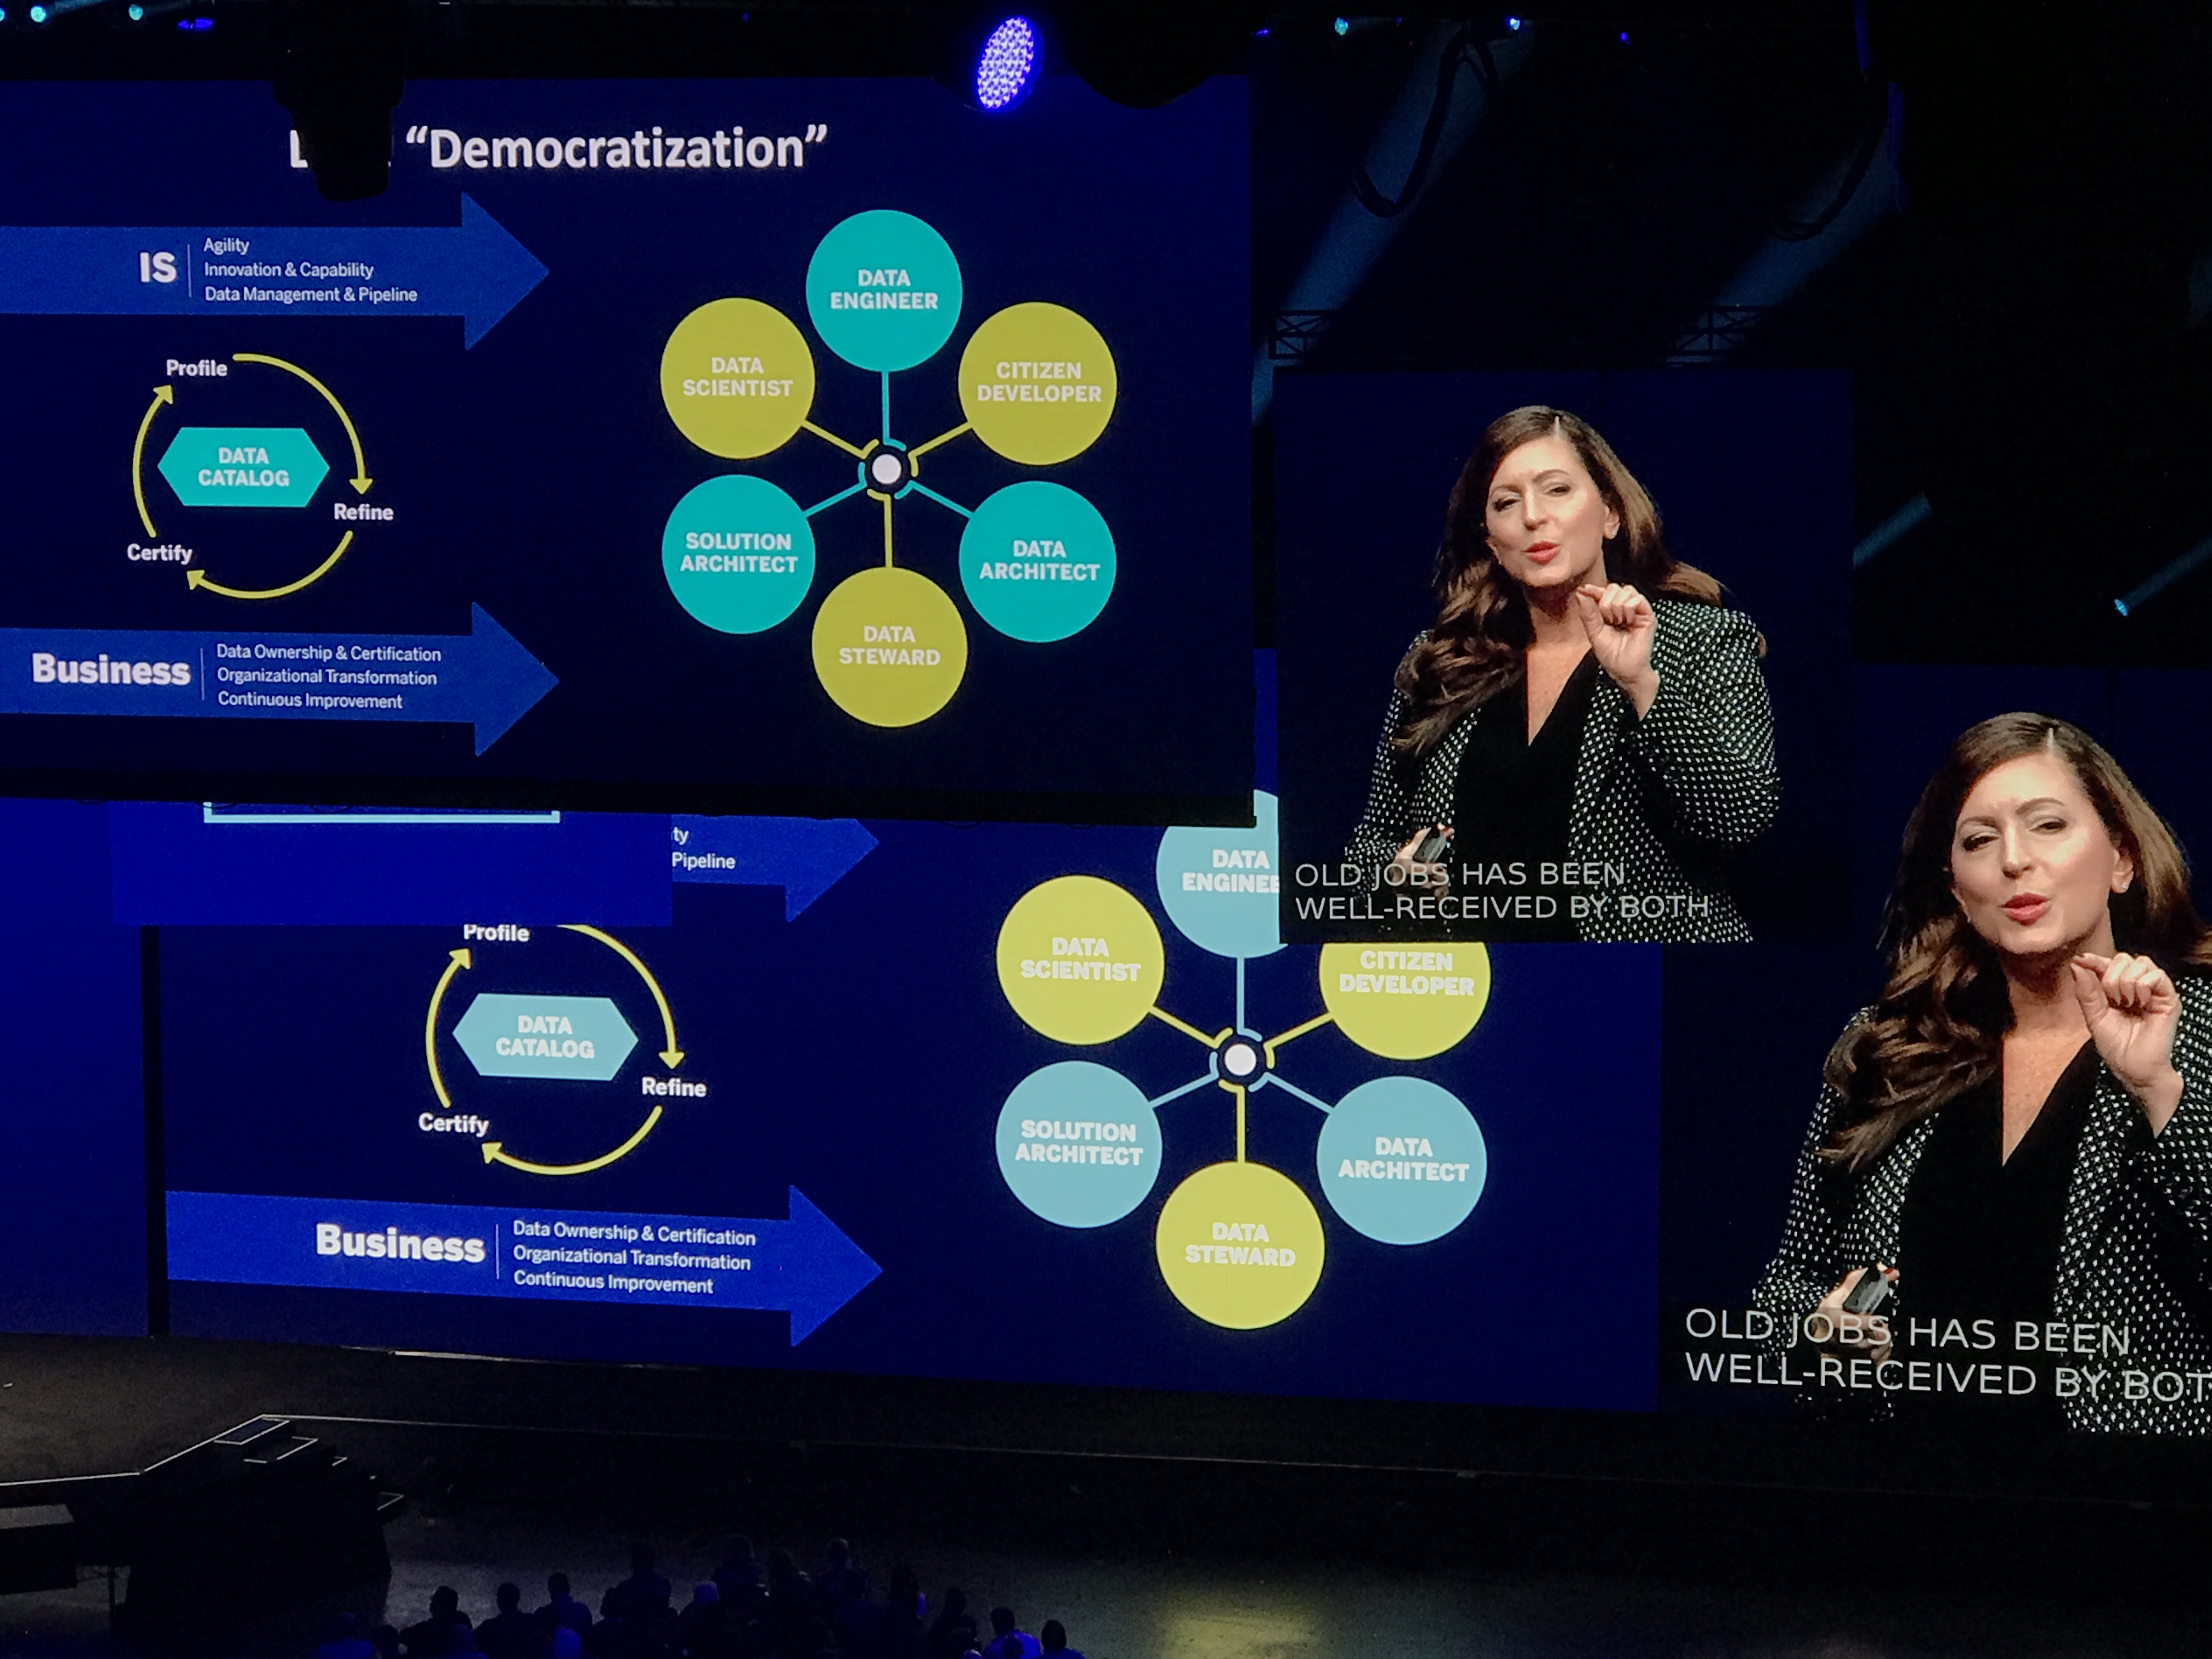
Tableau’s comparison between the popularization of the refrigerator and the democratization of analytics, machine learning, and AI as a whole is a good one. Many are still frowning at the notion of anyone across an organization benefitting from having access to data-driven decision making. Take a look at my previous post on Splunk’s Data-to-Everything strategy for additional context.
Everyone Benefits from Visibility – No Exceptions
Data can enhance the speed and quality of almost any decision for each business unit
Whether or not we make our decisions based on data-derived facts or implicit believes exclusively depends on how time-consuming and expensive it is to access and analyze data. It all comes down to one basic question: „Do I need a data scientist to get the interesting stuff done or can I rough something out myself real quick?“ Nobody is trying to eliminate the role of the pure-blooded data scientist, but in most cases the ability to run a quick regression or draw a simple line chart is already sufficient to put data behind many of our daily conversations and decisions. The data is almost always „out there“ within the corporate data center and cloud, and in the various public portals such as Yelp, Twitter, or the NYTimes Archive.
Really Everyone? Here Is What I mean
Organizations need to make data and analytics capabilities available „wall to wall“ to maximize staff productivity.
If we eliminate ALL technological obstacles in terms of data accessibility and analytics truly everyone could benefit from having access to data analytics. Let me type out a few examples of where I benefit from more data access and analytics, as I’m writing this article:
- Decision 1: If I spend 2 hours creating an interesting short video to supplement this article, will this be of interest to my different target audiences: EMA subscribers, social media followers, and consulting clients. Or will it decrease the number of views as readers would rather have the article to be published sooner? This question could easily be answered by looking at my own and my colleagues previous articles and how they performed in our library, on Twitter, LinkedIn, etc.
- Decision 2: I could skip the next analyst session and run to the floor to get a few software demos and 1:1 conversations in.
- Decision 3: Will customers be interested in a „best of showfloor“ report or would they rather see a few quick interviews with interesting vendors.
- Decision 4: How much time should I spend trying out Tableau’s freshly announced products? Or should I do this later?
- Decision 5: Does it make sense to add some of the key conference announcements to a couple of my existing articles that are mostly ready, but unpublished.
- Decision 6: When is a good time to break for renewing my Global Entry card that I accidentally had lapse. When should I schedule the in-person meeting for to minimize wait time and impact on my work and personal schedule.
- Decision 7: Can I safely push back one of my projects in favor of delivering a „quick thing“ to a customer today, or will that push this project into the new year?
I’m convinced that optimizing each one of these decisions could easily increase my personal productivity by 30%, enabling to choose between „working more“ or „playing more“ instead of plowing extra effort into sub- optimal workflow sequences and levels of effort. The reason why I am a Tableau user is that Tableau provides me with a toolkit that brings me close to being able to achieve these goals. But now, lets talk about what I would like Tableau to do to take us all the way to the finish line.
What I Want from Tableau
- I want Tableau to automatically generate a set of charts that reveal data quality, completeness, and most importantly, correlations inside of or between data columns that are interesting from a statistical perspective. Or even better, based on my previous reports. Example: when I import technology adoption data, I want Tableau to automatically cluster technologies that belong together so that I can answer questions such as „what Kubernetes technologies do customers typically adopt together with Tensorflow-based machine learning?“
- I want a much more efficient UI that lets me do things like bulk-creating metrics, warn me when I trigger a query that will stall the server,
- I want at least basic machine learning capabilities straight from within Tableau: sentiment analysis, concept extraction (NLP), regression, Principal Component Analysis, automated model fitting and evaluation. Also, I want the automatic elimination of columns that are confounding my analysis and I want to eliminate the horrible process of creating data frames by hand. Furthermore, I want ML to detect when my data is incomplete for a certain time period, instead of simply showing a dip on the chart that is due to only a week’s worth of data being available. I want Tableau to let me train a simple Bayes model for auto-categorization of records.
- I want Tableau to understand Text. Text network charts and word clouds are excellent tools to rapidly understand and visualize complex data frames.
- I want more types of charts and I want to be able to configure them more easily. And please fix the ongoing issue with overlapping or not showing lables.
- I want the Tableau Desktop client to consistently perform, even when I have two dozen data sources connected and warn me BEFORE executing a query how much time this query may take to execute.
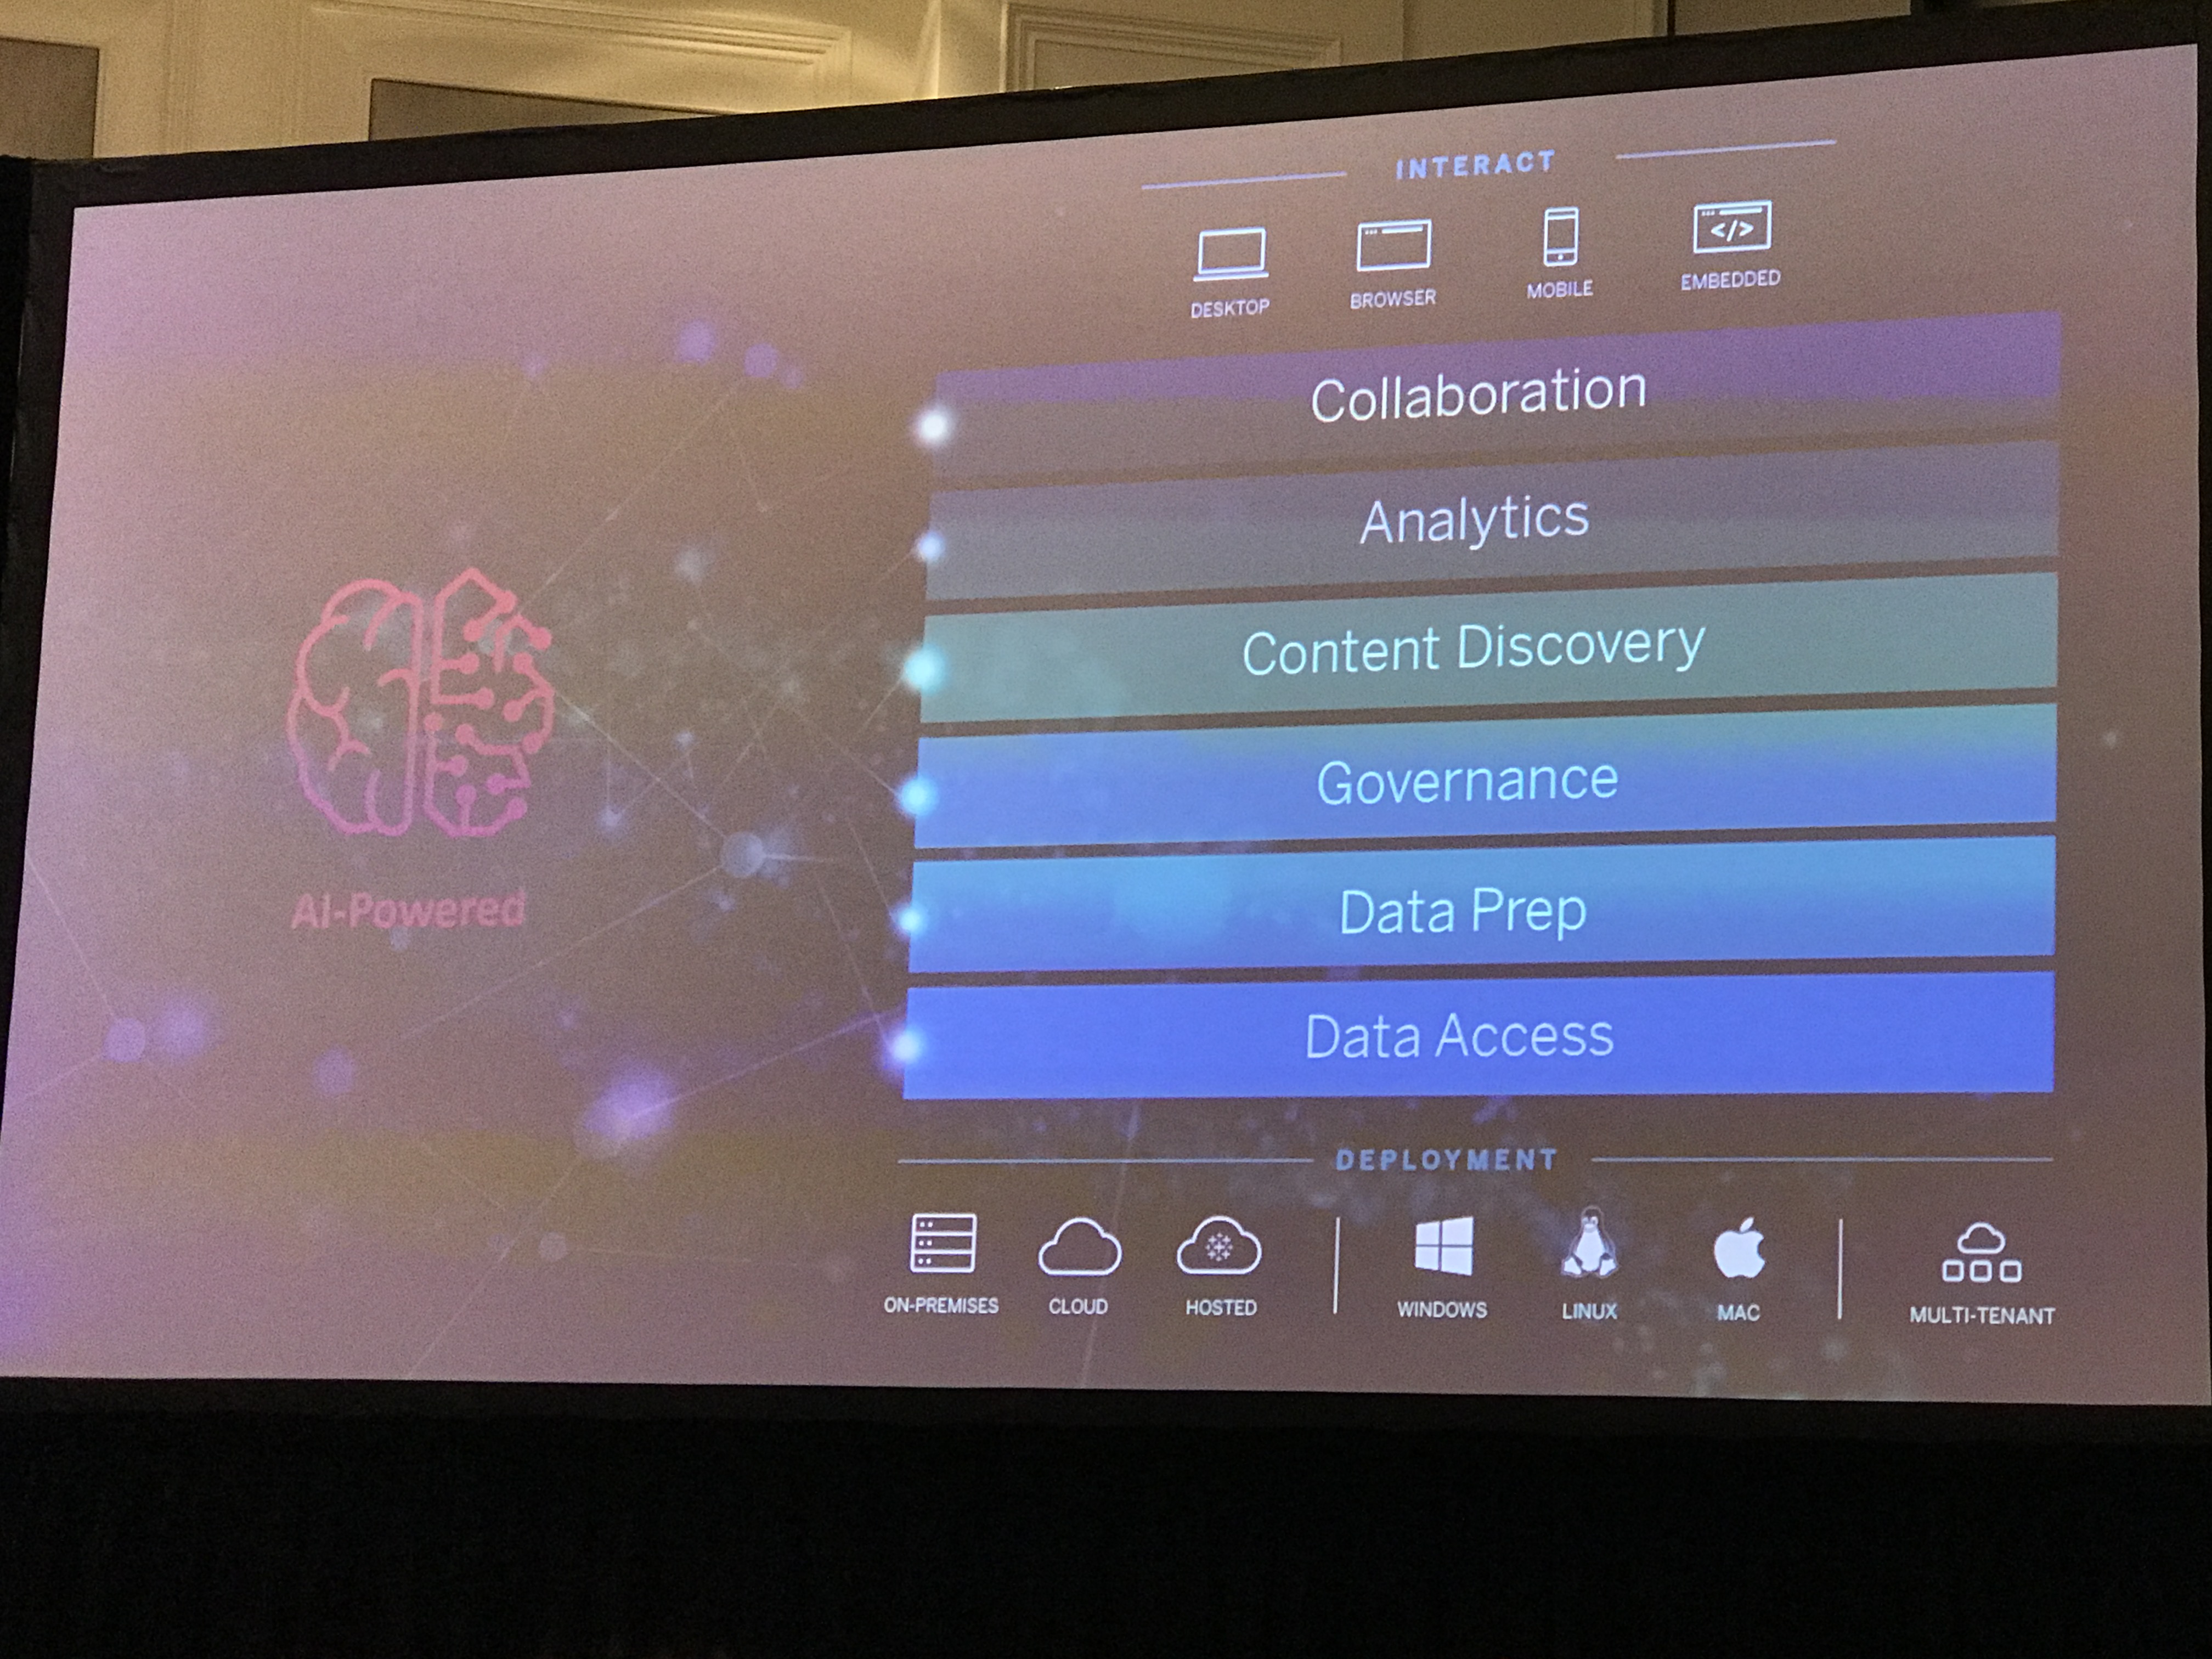
Tableau is currently working to infuse all layers of its product stack with machine-learning and AI-driven capabilities to simplify and optimize analytics.
That’s basically it. Stay tuned for my follow up article that will show in how far Tableau fulfilled my expectations this week and whether the acquisition by SalesForce will have positive roadmap impact.
Recent Comments