
Once a cloud solution such as vRealize Automation has been put into production, end-users can start deploying their own workload. However, with regard to traditional datacenters, there are still pains throughout the process. Administrators are responsible for security, growth and resource challenges. Those challenges are even more difficult to cope with when working in the cloud. Typical questions are how to control dynamic workload growth, how to support a distributed cloud management platform like vRealize Automation and how to keep the cloud healthy in future.
The answer to these questions – even before the cloud was introduced – is to utilize monitoring and management tools. There are a lot of such tools on the market and fortunately, VMware also provides adequate tools – vRealize Operations and vRealize Log Insight – that can easily be integrated into vRealize Automation.
This chapter will show how to integrate these solutions into vRealize Automation and will conceptually discuss how the aforementioned tasks can be solved.
17.1 Challenges of cloud monitoring
Basically, operators of a cloud environment have to take care that the cloud infrastructure is always working fully functionally. In particular, the following considerations arise:
- Different resources have to be monitored and not all workloads, applications or data sets are alike. Hence, operators have to make sure that appropriate monitoring profiles can be created.
- The best monitoring solution is worthless if it is either not running or running with problems. Hence, operators always have to ensure that their monitoring solution is running optimally and configurations are kept updated.
- The monitoring system should be able to understand the cloud and all its relationships.
- A good monitoring solution supports automation as well and is able to proactively remediate smaller configuration issues.
- The vRealize Automation infrastructure itself should be monitored. If errors occur, administrators should be able to detect the root cause of the problem and fix it as quickly as possible by having sufficient log and performance data.
- Cloud providers need to perform capacity monitoring.
- Cloud consumers should be able to rightsize their cloud resources in order to save capacity and money.
- Users should have access to a monitoring tool to be able to monitor their own workload.
After having discussed these challenges, let’s discuss how to solve these issues. First, we will cover how to setup and use vRealize Log Insight and second, how to work with vRealize Operations.
17.2 Using vRealize Log Insight
Basically, vRealize Log Insight helps users to centrally collect and analyze logs. Its greatest strength is the intuitive and quite easy to use graphical user interface, its speed for querying data and the built-in knowledge for other VMware products.
There are quite a lot of reasons to use vRealize Log Insight along with other VMware products in a vRealize cloud environment:
- First, you can use Log Insight to perform root cause analysis on your vRealize infrastructure.
- It could be used for centrally storing the log data of your customer’s workload.
- You can integrate Log Insight with vRealize Automation and vRealize Orchestrator to analyze why Orchestrator lifecycle workflows have failed.
- Log Insight can also be integrated with vRealize Operations to enrich vRealize Operations metric data.
17.2.1 Configuring Log Insight for vRealize Automation
Setting up Log Insight for vRealize Automation is quite easy, if you are using vRealize Automation 7.0.1 onwards, as the agent is already included in the appliance. To configure the appliance, perform the following steps:
- Use an SSH client like PuTTY to log in into the vRealize Automation appliance using the root user.
- Edit the /etc/liagent.ini configuration file.
- Configure the following settings (see Fig. 1).
- hostname=<Log Insight server hostname or IP>
- proto=cfapi
- port=9000
- Restart the Log Insight agent using the service liagent restart
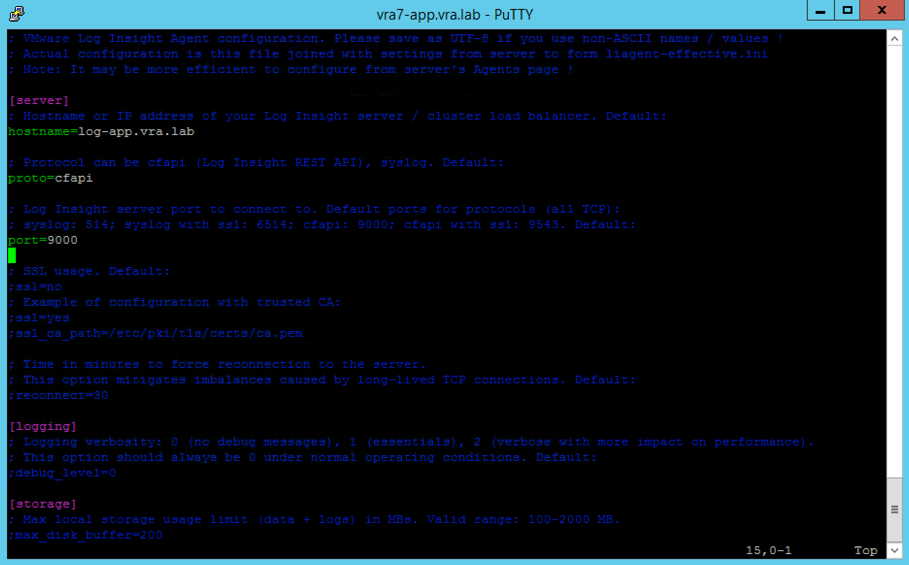
Fig. 1: Configuring the Log Insight Agent on the vRealize Automation appliance
Once the service has been restarted, the Log Insight agent will start the communication with the server. We can now log in into the Log Insight server and conclude our configuration. First, the appropriate content packs have to be downloaded:
- Within the Log Insight user interface, select Content Packs from the Administration menu on the upper right side of the screen (see Fig. 2).
- Scroll down within the list of content packs and select VMware –vRA7.
- Accept the licence agreement and click on Install.
- Repeat steps 1-3 for the Apache – CLF and VMware – Orchestrator content packs.
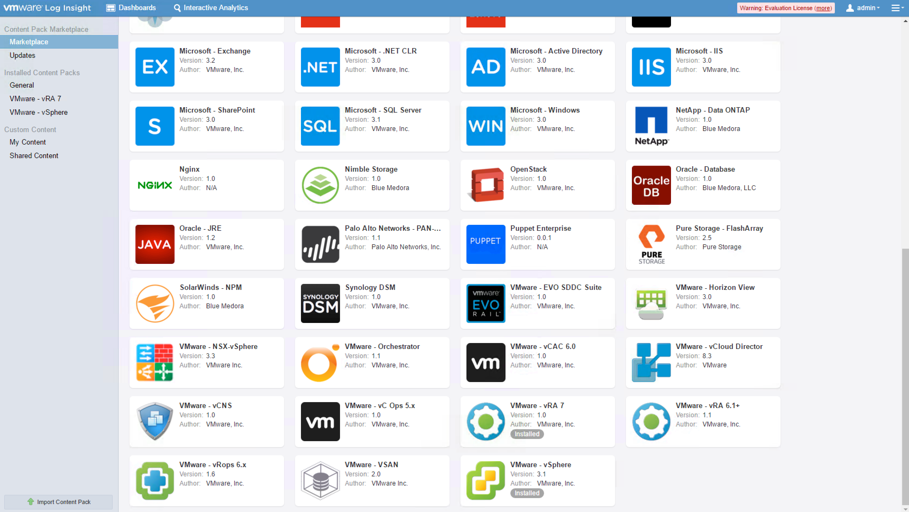
Fig. 2: Installation of content packs
Once the content packs and the agent have been configured, it’s a good time to check if the agent is sending data to Log Insight. This can be done by navigating to the Administration > Agents page. You can see the vRealize Automation appliance within the All Agents view (see Fig. 3).
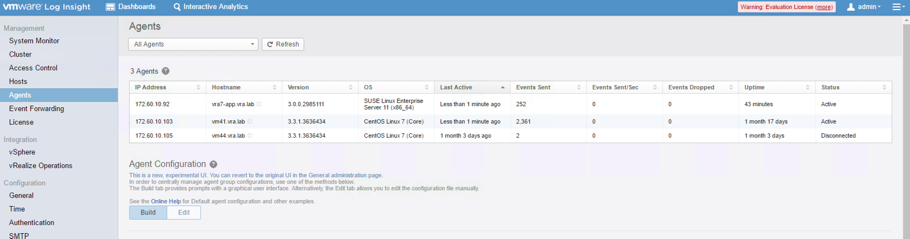
Fig. 3: vRealize Automation appliance agent in Log Insight
The last step in the configuration process is to apply an agent configuration template to the respective appliance. The best way is not to change the existing vRA template, but to copy it before any modifications. Perform the following steps:
- Within the All Agents view, search for the vRealize Automation – Linux template and click on the Copy Template.
- Provide a Name for the Agent Group, optionally change the Notes and click Copy.
- Next, use the filter to select the IP addresses of your vRealize Automation appliances.
- Click on Save New Group.
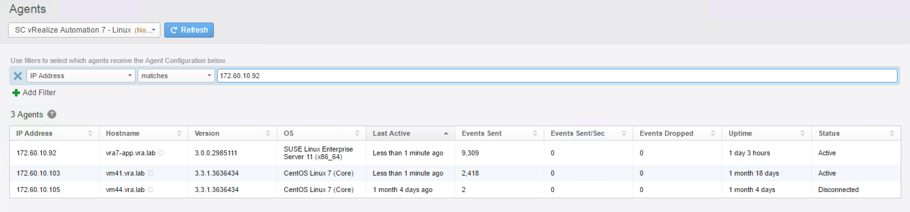
Fig. 4: Editing the vRealize Automation appliance agent group
We also need to change the Agent Group for the vRealize Automation 7 – Windows agent group:
- Within the All Agents view, search for the vRealize Automation – Windows template and click on the Copy Template
- Provide a Name for the Agent Group, optionally change the Notes and click Copy.
- Next, use the filter to select the IP addresses of your vRealize Automation appliances.
- For the Windows agent configuration, we have to change the DEO settings, because the directory settings are dependent on the installation’s settings. Hence, change the vra-deo settings according to your environment and click Save New Group.
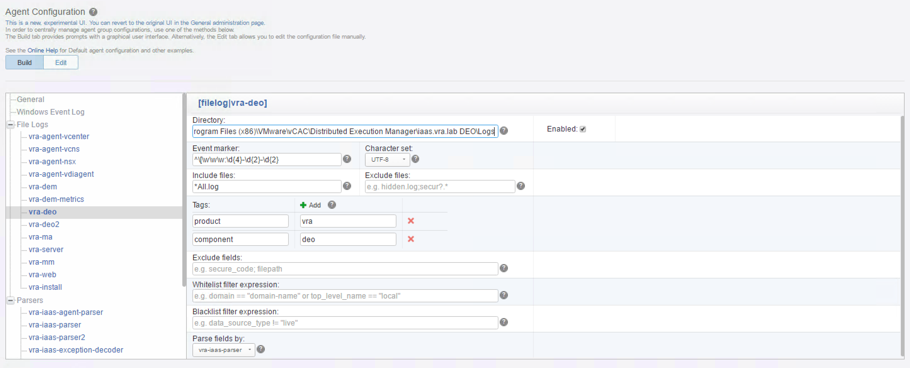
Fig. 5: Editing the vRealize Automation IaaS agent group
Once you have finished the configuration, you can use the following dashboards:
- General – Overview: Provides an overview about vRA events over time and status, Tomcat events over time, Workflow events over time, DEM events over time and Workflows executed over time
- General – Problems: Shows various error events by error message
- vRA – Appliance: Highlights vRA appliance specific messages and error counts
- vRA – App Authoring: Information about started, failed and completed software component deployments
- vRA – Catalog: Information about catalog requests
- vRA – Designer: Information about requests grouped by blueprint, state and failed requests
- vRA – Extensibility: Event broker log information
- vRA – Authentication: Authentication information
- vRA – IaaS: IaaS workflow information, data collections, Model Manager and lifecycle logs
- vRA – NSX: NSX logs
- vRA – Telemetry
Using Log Insight for root cause analysis on failed IaaS requests
Troubleshooting a failed IaaS deployment, is one of the most important use cases for using Log Insight in a cloud environment. The Catalog dashboard provides you with the necessary queries to perform root cause analysis on machine requests (see Fig. 6).
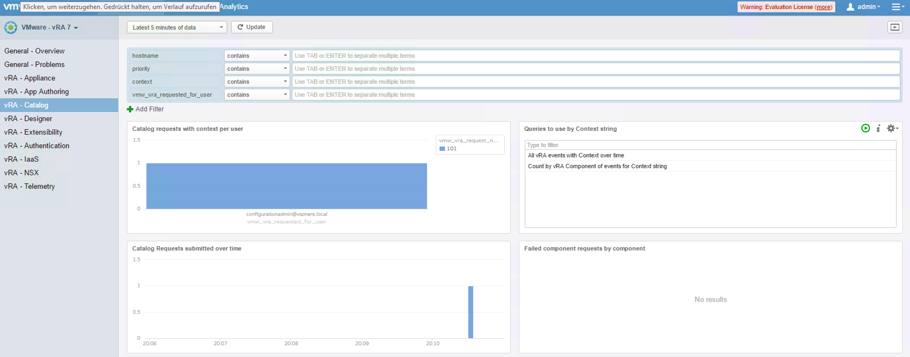
Fig. 6: Using the Log Insight Catalog dashboard
With the vRA catalog dashboard opened, you can click on the specific request number within the Catalog requests with context per user widget and change to the Interactive Analysis.
To see all log events related to a request number, search for the context attribute within a log event and copy the appropriate value (see Fig. 7).
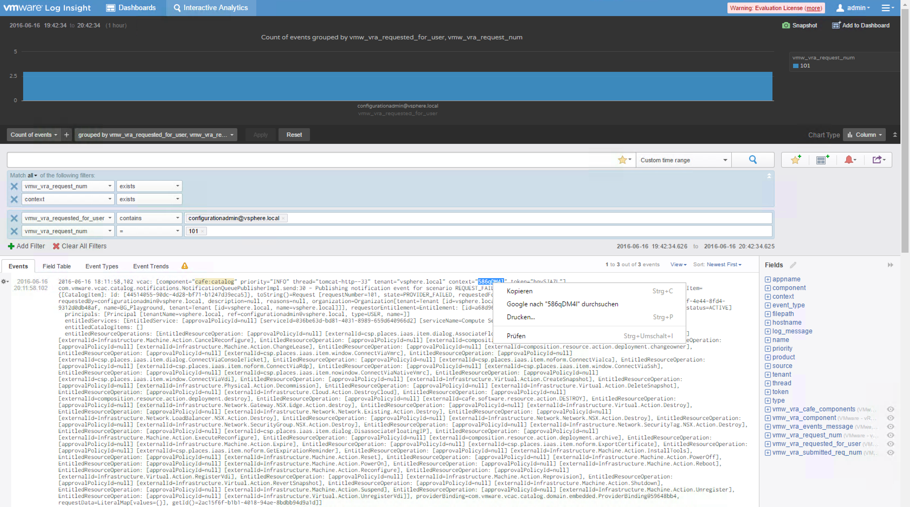
Fig. 7: Interactive Analysis for a catalog request
Next, go back to the Dashboard, paste the value into the context filter and click Update.
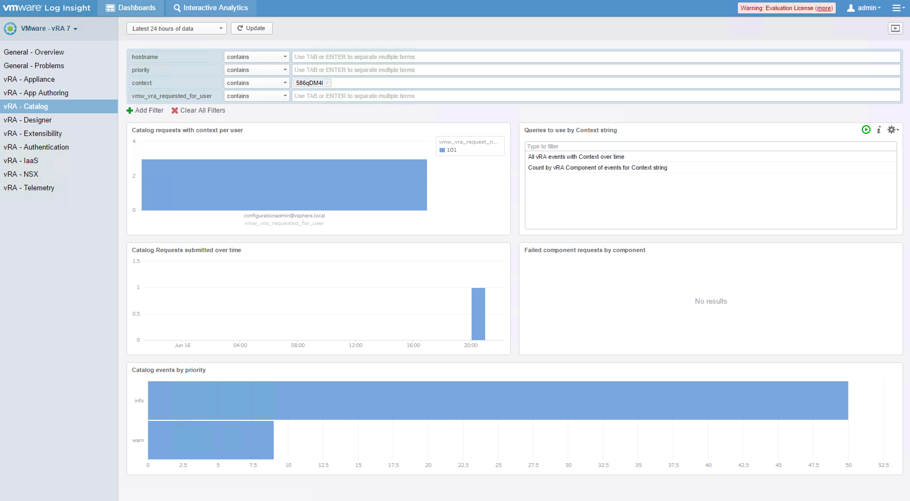
Fig. 8: vRA catalog with context filter
By clicking on the All vRA events with Context over time within the Queries to use by Context string widget, you can go back to the Interactive Analysis and see all request related log entries. In addition, you can add the priority filter to narrow down the log results on error log entries.
17.2.2 Integrating Log Insight into vRealize Operations
If you are using both Log Insight and vRealize Operations, you can easily integrate both products into each other. Integrating the two products brings the following advantages:
- Inventory Mapping: vRealize Operations provides information about virtual machines, e.g. the underlying cluster, the host or the used data store. Once Log Insight and vRealize Operations have been integrated, this metadata can be shown in Log Insight (vmw_datacenter, vmw_host, vmw_object_id, vmw_vcenter, vmw_vcenter_id, and vmw_vr_ops_id).
- Log Insight can forward alerts to vRealize Operations.
- Two-way launch in context: Administrators can easily see logs for specific vRealize Operations objects and open the analysis in vRealize Operations from Log Insight (see Fig. 9).
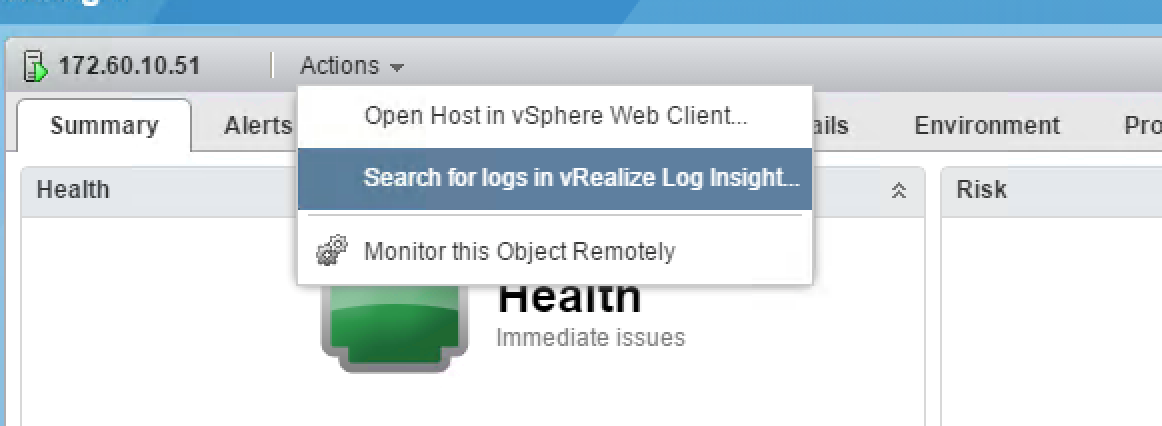
Fig. 9: Two-way launch in context
Perform the following steps for the integration:
- Go to the Administration
- Within the Integration section, choose vRealize Operations.
- Provide the Hostname.
- Enter a valid Username and Password for vRealize Operations.
- Click Test Connection, and if successful, click Save.
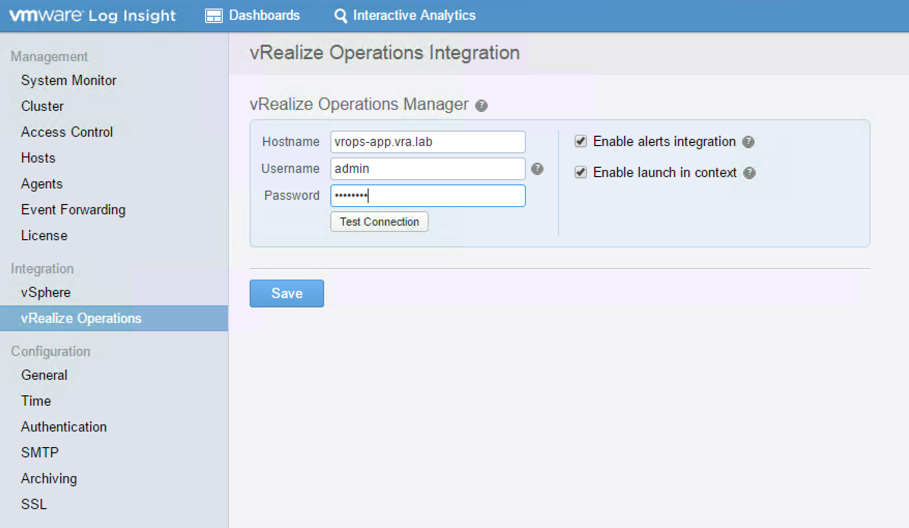
Fig. 10: vRealize Operations and Log Insight integration
17.3 Integrating vRealize Operations
Besides Log Insight, vRealize Operations plays an important role in a VMware cloud environment. In addition, VMware provides plug-ins for vRealize Automation to gain insights into the vRealize cloud. In the following, we will introduce these plugins, followed by how to perform capacity management and make the tool available to end users.
17.3.1 Installation of vRealize Automation plug-ins
There are two different management packs that are provided by VMware:
- The management pack for vRealize Automation extends operational management capabilities of the vRealize Operations Manager platform to provide tenant-aware operational visibility of the infrastructure supporting private clouds to cloud provider environments. The management pack provides three dashboards, additional analytics and support cloud constructs such as tenants, business groups, reservations or reservation policies.
- On the other side, the vRealize Automation Hyperic plugin discovers and monitors the vRealize Automation components and provides insights into their topology, availability and health.
Let’s begin with setting up the management pack for vRealize Automation.
17.3.1.1 Setting up the management pack for vRealize Automation
In order to begin with the installation we first have to download the plug-in– it can be found in the VMware Solution Exchange (VSX)[1].
The installation can be performed like any other solution that is uploaded to vRealize Automation by going to the Administration > Solutions menu. Once the installation has been completed, some configuration work has to be done:
- Within the Solutions page, select the newly added management pack and click on the Manage Solution button in the upper part of the screen.
- Provide a Display Name, optionally a Description and the vRealize Automation Appliance URL (see Fig. 11).
- Provide a valid Credential. Note that you have to specify a SysAdmin username – usually administrator@vsphere.local – and a SuperUser (a user with administrator privileges in all tenants).
- Click Test Connection and – if successful – save your changes.
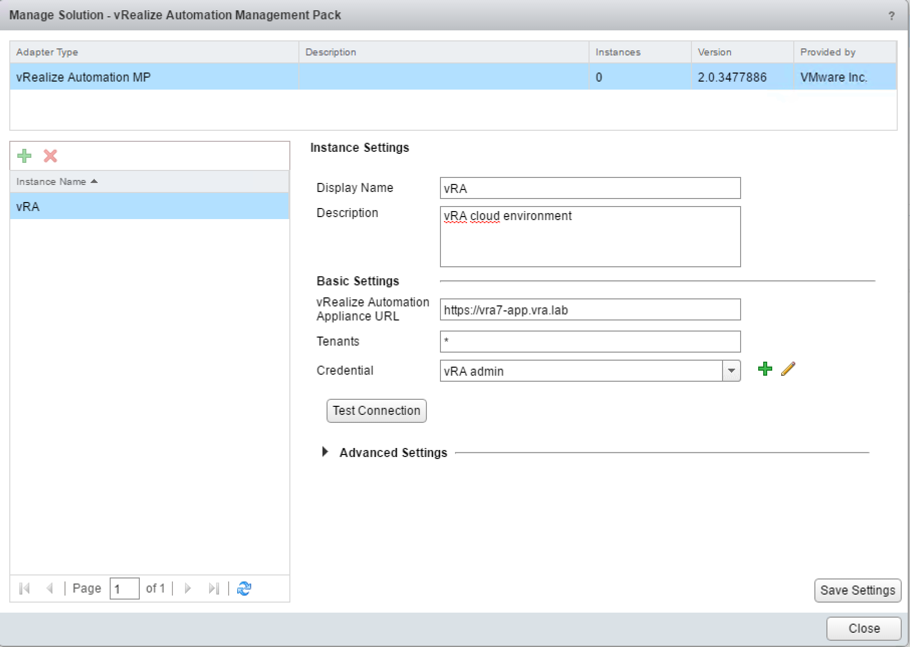
Fig. 11: Setting up the vRealize Automation management pack
Once you have finished the configuration and vRealize Operations was able to collect and analyze data, you can use the following built-in dashboards:
- vRA Automation Tenant Overview: This dashboard shows all the configured tenants along with an environment overview that shows tenants, business groups and blueprints. In addition, tenants and business groups at capacity risk are shown as well as top alerts.
- vRA Automation Cloud Infrastructure Monitoring: This dashboard shows a health and capacity overview of the different components and business groups and reservations at capacity risk.
- vRA Automation Top-N Dashboard: This dashboard shows the most used components from each category.
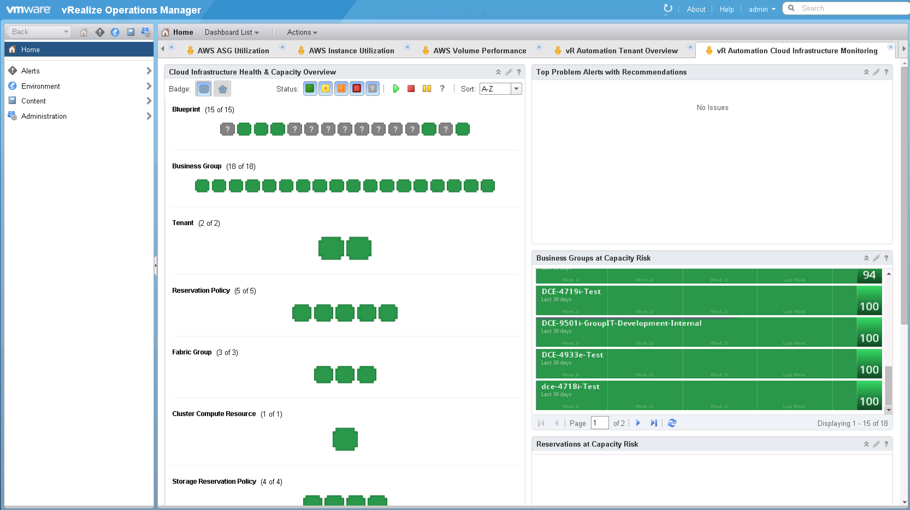
Fig. 12: vRA Automation Cloud Infrastructure Monitoring dashboard
In addition to using the built-in dashboards that ship with the vRealize Automation plug-in, you can also develop your own custom dashboard. For example, Fig 14 shows a custom dashboard, that lets administrators drill into each server of a business group and see current as well as historic values for selected metrics.
17.3.2 Setting up the Management pack for vRealize Hyperic
The other plug-in is for vRealize Hyperic and provides detailed application-aware monitoring of the full architecture of vRealize Automation. In detail, it offers the following functionalities:
- It provides an inventory tree object in vRealize Operations Manager specifically tailored to vRealize Automation.
- There is a set of pre-defined symptoms, alerts, and recommendations for vRealize Operations, specifically revolving around vRealize Automation monitoring.
Fig. 13 shows the plug-in in vRealize Operations. However, this plug-in has not been ported to vRealize Operations 6.2 and vRealize Automation 7, so we will not cover it in detail here.
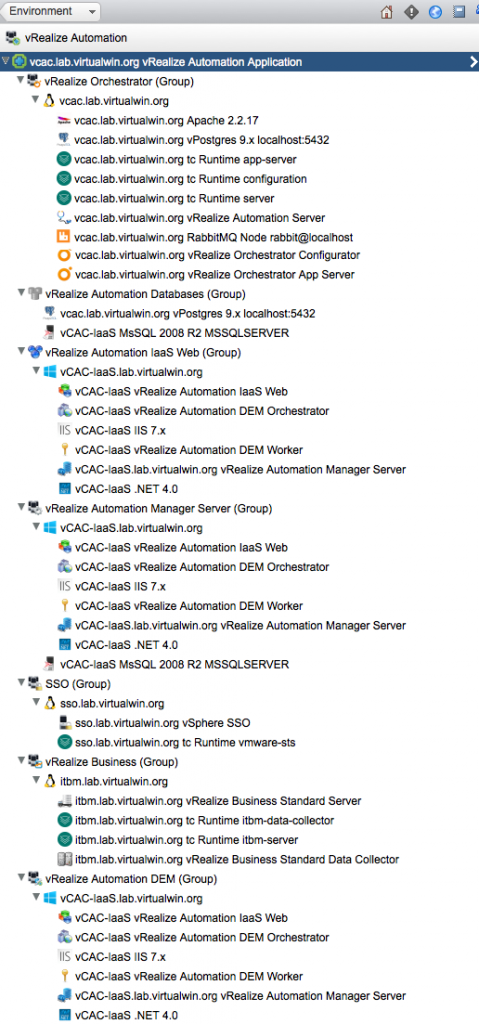
Fig. 13: vRealize Hyperic plugin for vRealize Automation
17.4 Using vRealize Operations for capacity management
Basically, capacity management can be largely grouped into two different areas:
- Operational
- Architectural
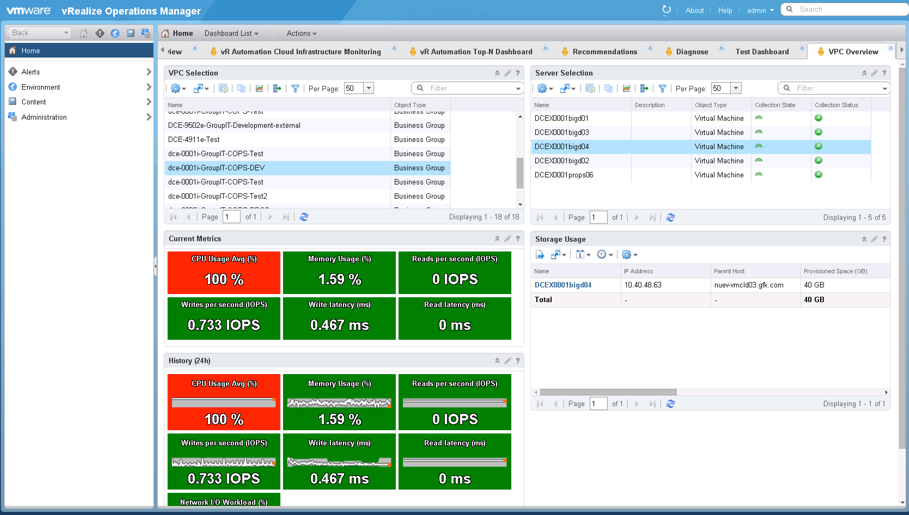
Fig. 14: Custom dashboard
Capacity management at the operational level
Virtualization alters the IT infrastructure team from being a system builder to being a service provider. This also holds implications for the operational level. The application team no longer owns the physical infrastructure, which now is a shared infrastructure. This creates a two-tier capacity management:
- At the VM level, capacity management is done by the application team. They determine the size of their VM, and then buy the capacity from the infrastructure team. They need to adjust the size, as oversizing leads to performance issues.
- At the physical infrastructure level, the infrastructure team must perform capacity management as a single team. The joint team must take care of computing, networking, storage, and DR. The mindset has to change from that of a system builder to that of a service provider.
Capacity management at the architectural level
The infrastructure moves from a tailored system to standardized hardware. The application team no longer needs to dictate the specifications of the hardware. For example, they do not specify a server brand, model, and CPU frequency. They can only specify how many virtual CPUs they need. Sometimes, especially in a large environment, they can only choose small, medium, or large vCPUs, and all of these have been preconfigured.
Once capacity management is split into the two distinct layers, it will become natural and will transform the infrastructure team into the service provider model. Customers do not need to know about the detailed specification of the cloud infrastructure as it is provided as a service. To achieve this, capacity planning for the three main infrastructure components (compute, network, and storage) will be unified towards an integrated capacity planning.
17.4.1 VM capacity management
The following components should be monitored on a virtual machine basis:
- Virtual CPU
- Virtual RAM (only private cloud)
- Virtual network
- Virtual disk IOPS
- Usable disk capacity left in the Guest OS (only private cloud)
This information can be used to rightsize the instance. vRealize Operations already provides recommendations for private cloud machines. So you could offload the monitoring of an individual machine to VM consumers in case you would like to give them access to vRealize Operations.
On the other side, vRealize Operations does not provide any recommendations for rightsizing public cloud machines. In that case, administrators need to experiment. In practice, this means to deploy a virtual machine with a certain set of machine resources. If vRealize Operations detects that the provided capacity is not used, we can begin to downsize the virtual machine hardware resources until a good compromise between over and under sizing is found.
When rightsizing a virtual machine, the responsible user has to find a trade-off between under sizing and over sizing. Under sizing can basically help to save money, but might cause low performance. Over sizing, on the other side – can lead to a waste of monetary resources. Usually, the actual health range depends on different criteria:
- The expected utilization
- The nature of the workload
- The service tier: For example, to prioritize machines, e.g. by putting resources into categories (e.g. bronze, silver or gold)
The remaining disk capacity inside the guest OS is also monitored. Although vCenter does not provide this information, vRealize Operations is able to do that – if the VMware tools are installed in the virtual machine.
17.4.2 Compute capacity management
There are different ways to do capacity management when having different service tiers in your environment. For example, you could set up a resource pool per service tier, assign dedicated ESXi hosts or use a cluster of each service tier. From these aforementioned solutions, many companies tend to have a dedicated cluster for each service tier because of its simplicity and ease of management. Let’s discuss the relevant metrics for such tiers. For each service tier a dedicated cluster can be installed. Service tiers encompass settings about CPU and RAM contention, storage settings, and network throughput.
Tier 1 metrics
Tier 1 machines are for services with no contention, hence the following metrics should be monitored by vRealize Operations:
- Total numbers of vCPU left in the cluster (Supply – Demand)
- Total number of vRAM left in the cluster (Supply – Demand)
- Total number of VMs left in the cluster
- Maximum storage latency experience by any VM
- Disk capacity left in the data store cluster
- Maximum network drop packets
- Total hosts, data stores, total VMs, Powered on VMs
- Average number of running machines per running host
- Number of wasteful VMs
Optimally, these numbers will be shown via line charts. Time lines will be at least 1 month, preferably 3 months.
Other tiers
For service tiers with contention, the following metrics can be monitored and shown:
- Maximum and average CPU contention experience by any VM in the cluster.
- Maximum and average RAM contention experience by any VM in the cluster.
- Total numbers of VMs left in the cluster.
- Maximum and average storage latency experience by any VM in the cluster.
- Disk capacity left in the data store cluster
- Density
- Total hosts, data stores, total VMs, Powered on VMs
- Average number of running machines per running host
- Total hosts, data stores, total VMs, Powered on VMs
- Average number of running machines per running host
- Number of wasteful VMs
17.4.3 Sample dashboards
When creating a dashboard, it is always good to have some samples for inspiration. A good place to start is the book “VMware vRealize Operations Performance and Capacity Management” by Iwan ‚e1‘ Rahabok or the blog vXpress by Sunny Dua[2].
17.5 Summary
This chapter introduced how to use vRealize Log Insight and vRealize Operations to perform troubleshooting, root cause analysis, monitoring, rightsizing, performance and capacity management. When implemented correctly, these tools and techniques can greatly enhance a cloud solution.
[1] https://solutionexchange.vmware.com/store/products/management-pack-for-vrealize-automation
[2] http://vxpresss.blogspot.de
Recent Comments